1] The Mystery of the Two Flames
A science museum unveiled a fascinating exhibit. Visitors entering a large hall saw two candle flames burning on a long table. The candles appeared completely real. They occupied different positions nearly 300 meters apart, and spectators could walk around them, view them from different angles, and examine them closely. Nothing about the display suggested that it was unusual.
At first, most visitors assumed they were looking at two ordinary candles. Yet those who spent time observing the exhibit began to notice something remarkable.
Whenever one flame flickered, the other appeared to flicker almost instantaneously. When one flame leaned slightly to one side, the other seemed to respond at virtually the same moment. The synchronization was so precise that it attracted the attention of both visitors and researchers.
As word spread, theories began to emerge. Some speculated that hidden sensors were monitoring one candle and transmitting information to the other. Others suggested that a sophisticated control system linked the two flames. A few wondered whether the exhibit was demonstrating some unusual physical phenomenon.
A team of scientists decided to investigate. They measured the timing of the apparent interactions and confirmed that the changes were synchronized to an extraordinary degree. Every movement observed in one flame seemed to have a corresponding movement in the other.
The evidence appeared compelling. The candles were separated by hundreds of meters, yet they behaved as though they were connected by an invisible thread.
Eventually, the museum revealed the explanation.
There were never two candles.
Months earlier, a single candle flame had been recorded using a specialized imaging system. That recording was later converted into a three-dimensional holographic video. The museum’s projection system displayed the same holographic recording at two different locations along the table. Visitors walking around the exhibit perceived each projection as a real candle because the holograms reproduced the appearance of a flame from multiple viewing angles.
The apparent connection between the two candles was therefore an illusion. No information was passing between them. No mysterious interaction was taking place. Both images were simply reproducing the same original recording. Every flicker, every sway, and every change appeared simultaneously because both displays originated from a single source.
What seemed to be evidence of communication between two distant objects was actually a consequence of incomplete knowledge about how the exhibit had been constructed.
A simpler analogy for easy understanding.
How are these flames co-related ?
To understand the idea more easily, imagine placing a candle in front of a screen containing two small pinholes. Light from the same candle passes through both pinholes and forms two separate images on a distant screen.
An observer who can see only the screen would naturally conclude that two independent candles exist somewhere behind it. After all, two distinct flames are visible, each occupying a different position.
If the real candle flickers, both images flicker. If the flame bends because of a breeze, both images change in exactly the same way. The observer may notice these correlations and begin searching for an explanation. Why do the two flames behave so similarly? How does one appear to know what the other is doing?
Years of observation might convince the observer that a hidden connection exists between the two apparent candles. Complex theories could be proposed to explain how information passes between them.
Yet the true explanation is far simpler. There was only one candle all along.
The two flames are not separate objects communicating with each other. They are merely two images of the same underlying source. Their apparent relationship exists because every change originates from the same candle.
The difficulty is that the observer never sees the candle itself. The observer sees only the images and must infer the unseen reality that produced them.
2] The Observer Who Saw an Object Split in Two
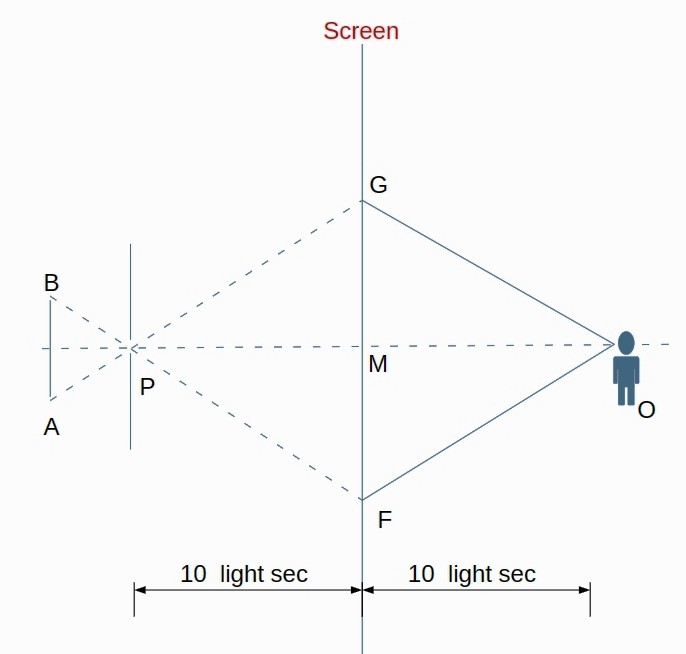
Consider the arrangement shown in the figure. A small object is located near points A and B, close to a pinhole P. A large observation screen is placed at Q, and an observer stands at O, seeing only the images formed on the screen. The actual object and its motion are hidden from the observer.
Case 1: Slow Motion (Stable Causal Mapping of Reality)
The object moves from point A to point B very slowly, taking about two minutes to traverse a distance of 1 mm. The event is recorded through a physical screen that is built from light signals, which propagate at a finite speed. A distant observer, located about 10 light-seconds away from the screen, receives this information only after a fixed delay.
In this regime, the key feature is causal synchrony. The object’s motion evolves slowly compared to the time scale of signal transmission. Each emitted light signal from the screen corresponds to a slightly shifted position of the object, but these signals remain properly ordered in time when they arrive. Even though the observer always sees the past, the structure of that past remains internally consistent.
As a result, the screen encodes a single, continuous trajectory from A to B. The delay does not distort reality; it only shifts when that reality becomes available. In this case, what is observed is a stable mapping between physical motion and recorded light-field information
Case 2: Ultra-Fast Motion (Breakdown of Continuous Mapping in the Recorded Field)
Now consider the same object moving from A to B, but the entire 1 mm displacement occurs in a microsecond. The object’s motion is now extremely fast compared to the time scale required for light to propagate, interact with the screen, and carry information to a distant observer.
Here, an important shift occurs—not in the object itself, but in the ability of the light-field representation to preserve temporal order.
Because light signals emitted at different moments of the motion are separated in time, they do not arrive at the screen or propagate outward as a clean, sequential chain. Instead, the screen is effectively interacting with overlapping fragments of the event, each carrying information from slightly different instants of the motion.
Because the distances travelled by light from A and B to different points on the screen are not identical, information about the object’s old and new positions reaches the observation screen at different times. For a brief interval, light carrying information from the earlier position and light carrying information from the later position can both be present on the screen simultaneously.
To the observer at O, something remarkable appears to happen. A single bright image suddenly splits into two images. One image appears to travel upward toward G while the other appears to travel downward toward F. The two images seem to move away from each other in opposite directions. After a short time, one of the images gradually fades and disappears, while the other remains.
Naturally, the observer is puzzled. It appears as though the object itself has divided into two separate objects. Unable to explain the phenomenon, he telephones his colleague standing near the pinhole.
His colleague listens and immediately understands the situation. “The object never split,” he explains. “I simply moved the object rapidly from A to B. What you are seeing is not two objects. You are seeing information from two different moments reaching your screen at different times. The apparent splitting is a consequence of the finite speed of light and the geometry of the pinhole system.”
The observer at O now realizes that the strange behaviour was not occurring in the object itself. The mystery arose because he was observing delayed information rather than the object directly. What appeared to be two objects moving apart was actually a single object whose history was arriving at the screen in a complicated way.
This simple thought experiment reminds us that observations are not always identical to reality. Sometimes the path taken by information can create appearances that seem mysterious until the hidden geometry of the system is understood.
A tricky question to you.
If that object switches between ON and OFF extremely rapidly within a microsecond, a single instantaneous measurement would normally integrate and lose that detail. However, in a system where information from different instants arrives sequentially due to finite light-speed propagation, these states can appear as a time-extended ON–OFF pattern over several seconds, even though the original event occurred within a microsecond.
The image of the object during one micro second is stretched to 10 seconds on the screen. We are seeing the on -off states on the screen! This means we have a method of seeing time events much less than a microsecond . Can this become a practical method to measure events which cannot be measured even by high speed cameras ? Please tell your opinions. The answer will be in part-3.
3] Predicting the Future?
Suppose I place nine numbered tokens into a box. The numbers range from 1 to 9. Before the experiment begins, I write a prediction on a piece of paper, fold it, and place it in an envelope. The prediction contains only a single number: It is “6”
I then hand the box to you.
Your task is simple. Reach into the box and randomly pick any two numbers. Suppose you happen to draw 3 and 7. Compare them, reject the smaller number, and write down the larger number, which in this case is 7. Then return both numbers to the box.
Now repeat the process. Perhaps this time you draw 5 and 8. Again, reject the smaller number and write down the larger one. Return both numbers to the box and continue.
Perform this experiment thirty-six times. Each time, select two numbers at random, keep only the larger one, write it down, and return both numbers to the box. At the end, add together all thirty-six recorded numbers and divide the total by thirty-six to obtain the average. Ignore any decimal places and read only the whole number part.
Now open the envelope.
In many cases, you will discover that the number written inside is exactly the same as the result you obtained: 6.
At first glance, this seems impossible. I never touched the box after making the prediction. I never saw which numbers you selected. I had no way of knowing the sequence of draws that would occur during the experiment. Every choice was random, and every trial was independent.
Yet somehow the prediction appears surprisingly accurate.
A skeptic might suspect a trick. Perhaps the box is manipulated. Perhaps the numbers are not truly random. Perhaps some hidden rule is influencing the outcome. Others may wonder whether probability itself contains patterns that are not immediately obvious. Is the future being predicted, or is something else happening beneath the surface?
The experiment becomes even more intriguing when repeated. Different people choose different pairs of numbers. The recorded sequences vary from trial to trial. No two experiments look exactly alike. Nevertheless, the final answer often seems drawn toward the same value, as though an invisible hand were gently guiding the result.
Why should this happen?
Is it merely a coincidence? Is it a consequence of the rules of the game? Or does it reveal something deeper about the way randomness behaves when many events are combined together?
Before reading further, try the experiment yourself. Perform the selections honestly, calculate the average, and compare it with the prediction. If the result surprises you, you are not alone. Many people encounter this puzzle and immediately begin searching for hidden explanations.
Perhaps the most interesting question is not whether the prediction works, but why it works. Sometimes a mystery is more valuable than its solution, because it forces us to question our assumptions about chance, prediction, and the meaning of probability itself.
The explanation
When two numbers are selected say 1,2, one is decarded and 2 is selected. The number 1 will never get a chance to become grater, as it is the least. So it is recorded zero times. Similarly, 2 will be recorded only 1 time, when it is 1,2. The table; is give below.
Number Times Recorded
1 → 0 times
2 → 1 time
3 → 2 times
4 → 3 times
5 → 4 times
6 → 5 times
7 → 6 times
8 → 7 times
9 → 8 times
Total =
(1×0) +
(2×1) +
(3×2) +
(4×3) +
(5×4) +
(6×5) +
(7×6) +
(8×7) +
(9×8)
= 240
Total number of trials =
0 + 1 + 2 + 3 + 4 + 5 + 6 + 7 + 8
= 36
Average = 240 / 36
= 6.67
Discarding the decimal part gives:
6
The prediction was not based on knowing which numbers would be drawn. It followed directly from the rules of the experiment. Once the selection rule was fixed, the average was already hidden within the structure of the game.
What will be in part-3 ?
Before moving on, consider a simple question. If every mystery in this part became less mysterious when hidden information was revealed, what would happen if we had access to all information about a system? Would probability disappear entirely? Or would uncertainty remain even then? The answer is far from obvious. In Part 3, we will venture deeper into the relationship between information, determinism, and probability, and ask whether randomness is fundamental—or merely a shadow cast by our ignorance. Also, the answer to the question of measuring less than a microsecond !
If you don’t want to miss it, subscribe:
Subscribe to our newsletter!

